
A Technical Leader's Guide to the Graphic Design Process
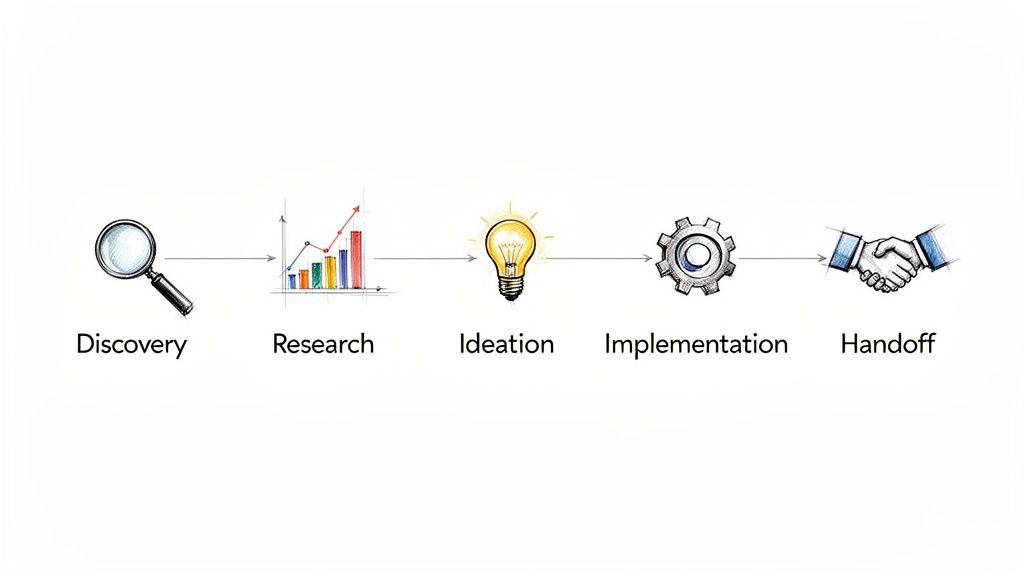
The graphic design process is not an artistic ritual; it’s a structured, problem-solving framework designed to translate business goals into visual interfaces. It is best understood as a five-phase system: discovery, research, ideation, implementation, and handoff.
For a technical leader, understanding this process is critical for de-risking projects and containing the scope creep that derails development cycles.
Deconstructing the Graphic Design Process
Many engineering leaders view design as a “black box”—a subjective, unpredictable activity that creates friction with development. Data suggests this perception is a primary source of conflict between teams.
A mature design process, however, is as methodical as an agile sprint. It is a system for progressive risk reduction. Ideas are validated through low-cost prototypes long before any code is committed. For a deeper analysis, several primers on the complete design process in graphic design break down the fundamentals.
This is not about aesthetics. It is a business function that directly impacts user adoption, development efficiency, and product-market fit.
A Framework for Predictable Outcomes
From an engineering perspective, the parallels are clear. Discovery and research are equivalent to requirements gathering and technical specification reviews. Ideation and prototyping function like unit tests, isolating and validating parts of a solution in a low-cost sandbox.
A disciplined design process front-loads difficult questions. It forces stakeholders to define success quantitatively and validate user needs empirically, transforming subjective opinions into data-driven decisions.
Integrating this structured approach into a workflow yields several measurable outcomes:
- Reduced Rework: An estimated 70% of projects fail due to poor requirements gathering. The discovery phase is engineered to mitigate this risk. Validating concepts with prototypes before development is the primary mechanism for preventing the construction of incorrect features.
- Forced Alignment: The process generates shared artifacts—like user personas and journey maps—that align business, design, and engineering stakeholders. These documents create a consensus on user identity and the problem being solved.
- Accelerated Delivery: A proper technical handoff delivers a complete design system with reusable components, not just a folder of static mockups. This becomes the single source of truth for the front-end team, eliminating ambiguity and accelerating implementation.
When a CTO treats the graphic design process as a predictable component of the software development lifecycle, they can manage it for outcomes rather than treating it as a variable cost.
The following is a breakdown of the process from a technical perspective.
Core Phases of the Graphic design Process
| Phase | Objective for Technical Teams | Key Deliverable |
|---|---|---|
| Discovery | Define “What” & “Why.” Align on business goals, technical constraints, and success metrics. | Project Brief with defined KPIs, scope, and known constraints. |
| Research | Understand “Who.” Validate user needs and analyze the competitive landscape. | User Personas & Competitive Analysis Report. |
| Ideation | Explore potential solutions. Brainstorm and validate concepts at low fidelity. | Wireframes & User Flow Diagrams. |
| Implementation | Build and test the solution. Develop high-fidelity, interactive designs. | Interactive Prototypes & Usability Test Results. |
| Handoff | Equip engineering to build. Deliver a comprehensive package of assets and specs. | Design System with component library & technical specifications. |
Each deliverable serves as a checkpoint to ensure the project remains on track before committing additional resources. It is a system designed for clarity, not chaos.
Phase 1 and 2: Discovery and Strategic Research
This is where project outcomes are determined. Industry data indicates that up to 73% of projects fail to deliver value due to poorly defined initial requirements.
For a technical leader, the Discovery and Research phases are the direct equivalent of a rigorous technical spec review. Bypassing them is analogous to committing to a microservices architecture without understanding the business domain—you risk building a technically sound product that solves the wrong problem.
The Discovery phase establishes a shared reality. It involves stakeholder interviews to define explicit business goals and quantifiable success metrics. These are not vague aspirations like “improve user experience” but concrete KPIs such as “reduce user onboarding support tickets by 30%” or “increase new user activation from 15% to 25%.”
Without this alignment, the design process rests on a foundation of unvalidated assumptions, leading to extended revision cycles, scope creep, and budget overruns as the project’s true purpose emerges late in the lifecycle.
Translating Business Goals into Design Problems
Once Discovery defines the “what” and “why,” Strategic Research addresses the “who” and “how.” Designers shift from internal opinions to external, data-backed insights about the market and users. This is not an optional step; it is the primary method for de-risking the entire investment.
Key artifacts to expect:
- Competitor Benchmarking: An analysis of direct and indirect competitors to identify established design patterns, market gaps, and opportunities for differentiation. This is about leveraging existing user expectations, not imitation.
- User Personas: Detailed, research-backed profiles of target users that extend beyond demographics to include goals, motivations, and pain points. This ensures the team designs for a specific user profile, not a generic abstraction.
- User Journey Mapping: A visualization of the end-to-end user experience. This map identifies friction points and opportunities for improvement, providing a clear roadmap for where to focus design and development resources.
A common failure mode is treating user research as a one-off task. Effective research is a continuous cycle of hypothesis generation and validation. It replaces subjective debates with empirical evidence about user behavior.
This research provides immediate returns. For instance, a journey map might reveal that 80% of user drop-offs occur during a convoluted sign-up process. That data immediately prioritizes simplifying that workflow over redesigning a less critical feature, focusing engineering resources where they will have the greatest business impact.
Pre-Design Diligence Checklist
Before wireframing begins, a design partner must provide clear answers to core strategic questions. This checklist functions as a go/no-go gate before entering more resource-intensive ideation and development phases. An inability to answer these questions is a significant red flag.
The Pre-Design Go/No-Go Questions:
- Problem Definition: Can the primary user problem and business objective be articulated in a single sentence?
- Success Metrics: What specific, measurable KPIs will define success (e.g., increase in conversion, reduction in task completion time)?
- Target User: Is there a validated user persona, and is every stakeholder aligned on who it is?
- Technical Constraints: Have all known technical limitations, API dependencies, and platform requirements been documented and shared with the design team?
- Scope Boundaries: What specific features or user flows are explicitly out of scope for this phase?
Ensuring these questions have validated answers links upfront work directly to preventing budget overruns and schedule slippage. It transforms the early stages of design from a subjective exercise into a disciplined, data-driven foundation.
Phases 3 and 4: Ideation and Iterative Prototyping
Once the problem is defined, the process shifts from what to exploring how. Abstract ideas and user data are converted into tangible, interactive artifacts.
Ideation and prototyping are not unstructured brainstorming. They are a systematic methodology for exploring and validating solutions before committing engineering resources to implementation.
For a technical leader, this is the direct equivalent of a unit testing and CI/CD loop. Designers are debugging usability and clarity, not code. The objective is to invalidate flawed ideas at low cost and replace subjective stakeholder opinions with data from user interactions.
This infographic breaks down the research steps that inform the ideation phase.
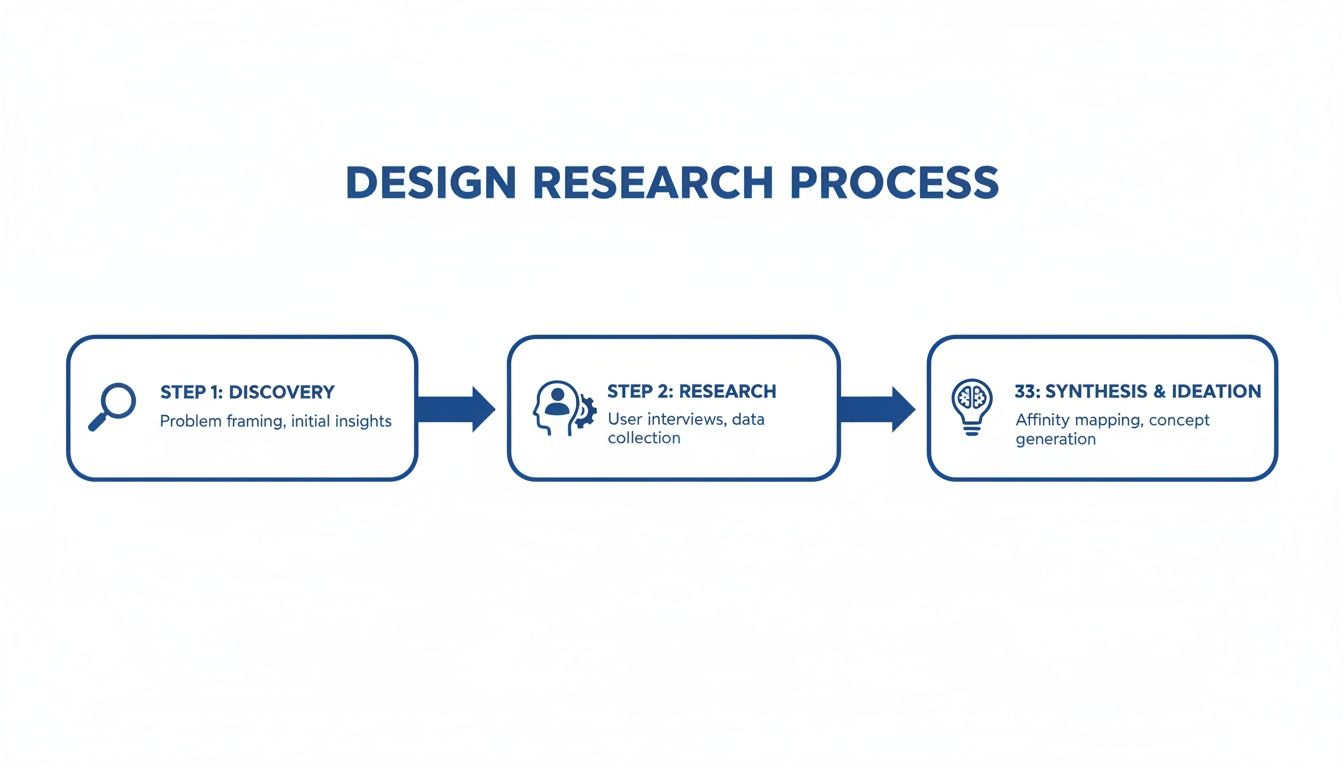
Effective ideation is built on a foundation of discovery, ensuring every concept is tied to a validated user need.
From Low-Fidelity Concepts to Testable Artifacts
Ideation begins with low-fidelity concepts to focus on structural integrity.
Key activities and deliverables include:
- Sketching & Wireframing: These are architectural blueprints for a user interface. They are intentionally stripped of visual polish to force focus on layout, information hierarchy, and user flow. Wireframes answer one question: Does the structure make sense?
- Mood Boards: A curated collection of visuals—colors, typography, images—that establishes an aesthetic direction. A mood board secures stakeholder agreement on the intended look and feel before detailed design begins, preventing subjective debates later.
These initial steps explore a wide range of possibilities at low cost. Once a direction is selected, the process moves from static images to functional prototypes.
The Power of Iterative Prototyping
Prototyping is a progression from low-fidelity to high-fidelity, enabling the team to test different aspects at each stage.
For engineers, prototyping is a primary risk mitigation tool. A clickable wireframe that reveals a critical flaw in a user flow has a near-zero cost to fix. The same flaw discovered after back-end implementation can cost 100x more to correct.
Low-Fidelity Prototypes
These are typically clickable wireframes built in tools like Figma or Balsamiq. They simulate the user journey without final visual design elements to test usability and flow.
- Objective: Validate core structure and task completion paths.
- Key Question: Can a user successfully navigate from point A to point B to complete their intended task?
High-Fidelity Prototypes
These are interactive mockups that approximate the look and feel of the final product, incorporating branding, typography, and UI elements. Our guide on effective web page layout examples shows how this structure informs the final appearance.
- Objective: Test the complete user experience, including visual appeal, accessibility, and micro-interactions.
- Key Question: Does the design feel intuitive, trustworthy, and aligned with brand standards?
This build-test-refine loop is central to a modern design process. However, it requires discipline. Surveys show 62% of projects exceed their timelines due to uncontrolled iteration loops, with revisions averaging 7-12 per job. While process time allocation is relatively stable—research (20%), wireframing (15%), prototyping (25%), feedback (25%), final output (15%)—ROI increases by an estimated 35% when these iterations are driven by quantitative data rather than stakeholder opinion.
Phase 5 and 6: Production and Technical Handoff
The transition from a validated prototype to a live product is a common point of failure.
The final phases of the graphic design process—Production and Handoff—are not about delivering a .zip file of mockups to engineering. This is the critical interface where design intent is translated into a scalable, maintainable front-end. A poorly managed handoff results in delays, bugs, and technical debt.
From Design to Design System
The most valuable asset from the Production phase is the design system. This is not a style guide; it is the single source of truth governing the entire UI. For a technical leader, requiring a robust design system is non-negotiable.
A design system functions as the API between designers and developers. It provides a library of well-defined, reusable components that eliminates ambiguity, increases development velocity, and ensures consistency at scale. Without it, you are shipping a collection of one-off pages, not a cohesive product.
A proper design system is a living repository that includes:
- Component Libraries: A full catalog of pre-built UI elements like buttons, forms, and modals, complete with all defined states (hover, disabled, active).
- Style Guides: The rulebook for typography, color palettes, spacing grids, and iconography.
- Asset Repositories: All icons, illustrations, and images, correctly formatted (e.g., SVG for icons) and optimized for performance.
The upfront investment to build this system yields immediate returns. Teams with mature design systems report development speed increases of up to 50%. Engineers can assemble new features from tested components instead of building them from scratch.
The Anatomy of a High-Quality Technical Handoff
A high-quality handoff eliminates guesswork. The goal is to provide engineering a package so clear that a developer can build the UI with minimal clarification. This requires creating clear step-by-step guides for implementation, not just static images.
Modern tools like Figma and Sketch facilitate this, but the tool does not guarantee quality. Here’s what an engineering team should require.
The following are non-negotiable deliverables engineering teams must receive from their design partners.
Essential Components of a Technical Design Handoff
| Artifact | Purpose in Development | Failure Mode if Missing |
|---|---|---|
| Interactive Prototype | Serves as the primary reference for animations, micro-interactions, and user flows. | Developers are forced to guess at interaction logic, leading to a clunky and disjointed user experience. |
| Design System Access | Provides direct access to all components, styles, and assets in a central, version-controlled location. | Inconsistent UI implementation, duplicate CSS, and a codebase that becomes progressively harder to maintain. |
| Detailed Specifications | Includes exact values for spacing, typography sizes, colors, and responsive breakpoints, often auto-generated by design tools. | ”Pixel-pushing” churn where developers make small visual adjustments based on subjective feedback instead of a clear spec. |
| Optimized Asset Files | All necessary image and icon assets exported in the correct formats (SVG, PNG, WebP) and sizes. | Poor application performance due to unoptimized images; blurry or distorted visuals from incorrect file formats. |
The technical handoff is where design is translated into code. A weak process here directly translates into wasted development cycles, technical debt, and a final product that does not match the approved design. It is a critical control point for shipping quality software on schedule.
How to Select the Right Design Partner
Selecting a design partner based on a portfolio is a common and costly error. A technical leader requires more than visual artifacts; you need a partner whose process minimizes friction, delays, and technical debt for your engineering team.
The goal is to find a partner who operates with an engineering mindset: systematic, with a focus on solving business problems. Their ability to justify a design decision is more valuable than the aesthetic itself. This requires an evaluation of their methodology, not just their final product.
Moving Beyond the Portfolio Review
A portfolio shows what a partner can produce under ideal conditions. It does not reveal how they handle ambiguous requirements, conflicting stakeholder feedback, or technical constraints. Evaluate their graphic design process as a risk-management framework.
Consider the 1980s. Before desktop publishing tools like Aldus PageMaker (1985), prepress was a manual process of paste-up and phototypesetting that took 40-60 hours per layout. PageMaker allowed a single designer on a $2,500 Apple Macintosh to move from concept to final output in under 4 hours—a 500% productivity increase.
This productivity leap parallels challenges in software modernization. CTOs using platforms to analyze 200+ partners are mitigating the modern equivalent of those “paste-up” inefficiencies. A partner’s tools and processes directly determine their efficiency and failure rate.
Actionable Vendor Evaluation Checklist
These questions are designed to penetrate marketing claims and reveal a potential partner’s operational maturity.
Discovery and Research Questions
- How do you translate a vague business objective into specific, measurable design KPIs?
- Describe a situation where you received conflicting feedback from stakeholders. How did you resolve it?
- What specific artifacts do you produce during user research, and how do you use them to justify design choices?
Prototyping and Handoff Questions
- What tools do you use for prototyping and managing usability testing with users?
- Describe your handoff process. What is included in the package delivered to developers?
- How do you document component states, interaction logic, and responsive breakpoints for engineers?
A partner who can answer these questions with specificity likely has a mature process. For a more structured approach, our guide on writing an RFP for website design provides a complete framework.
Red Flags and When Not to Hire
Identifying a poor fit early can prevent a project reset that costs months and significant budget.
The most significant red flag is a designer who cannot connect their choices to a business goal or a user need. If their primary justification is “it looks modern” or follows a design trend, they lack the required strategic depth.
Be cautious of partners who:
- Focus on trends: They prioritize the latest visual style over solving the core problem.
- Lack technical curiosity: They do not ask about your tech stack, development workflow, or technical limitations. This indicates a high probability of handoff friction.
- Promise a “frictionless” process: They oversimplify the reality of iteration and stakeholder management. Real projects require navigating complexity.
When NOT to hire a specific partner: Do not hire a firm that primarily showcases branding and print work for a complex SaaS application. Their process is not optimized for user flows, component libraries, or the iterative cycle of software development. This mismatch will likely result in a problematic handoff and a non-viable design system.
Common Failure Points in the Design Process
A structured process does not make graphic design immune to failure. For technical leaders, identifying common failure points is key to preventing projects from consuming excess time and budget. Most design projects fail due to poor communication and breakdowns in process discipline.
The core steps—research, sketching, production—have remained fundamentally unchanged for centuries. The process can be traced back to the 15th century and Johann Gutenberg’s movable-type printing press (c. 1450). His workflow of research, typesetting, and proofing is still recognizable. The Industrial Revolution accelerated this with the invention of lithography in 1798, which cut reproduction costs by up to 80% and enabled rapid iteration. The history of graphic design shows a clear lineage to modern workflows.
Projects today fail for the same historical reasons: inadequate upfront work and misaligned expectations.
Incomplete Discovery and Misaligned Goals
The most common cause of project failure is a rushed or non-existent discovery phase. When teams begin design work without first establishing specific, measurable business goals, the project is unlikely to succeed. This is the design equivalent of an engineering team starting to code without a technical specification.
This error manifests in predictable ways:
- Endless Revision Cycles: Feedback becomes a series of subjective opinions (“I don’t like blue”) because there is no objective goal to measure the design against.
- Scope Creep: Without clear boundaries, stakeholders continuously add requirements, leading to schedule and budget overruns.
- Solving the Wrong Problem: The final product may be aesthetically pleasing and technically sound, but it fails to impact key business metrics because it did not address the actual user need.
A project brief without quantifiable KPIs—like “increase user activation by 15%” or “reduce support tickets by 20%“—is a wish list, not a specification. It guarantees friction.
Stakeholder Feedback Spirals
Another common breakdown is the management of stakeholder feedback. Unstructured feedback via ad-hoc emails and Slack messages can create a spiral of conflicting opinions that paralyzes the project. This is particularly problematic when feedback is purely aesthetic (“Can we make the logo bigger?”) rather than strategic (“Does this color meet our accessibility contrast requirements?”).
The solution is to designate a single point of contact to collect, consolidate, and filter all feedback. This individual is responsible for ensuring every comment is tied to the project’s stated goals, insulating the design team from subjective requests that do not serve the user or business objectives.
For guidance on vetting partners with disciplined feedback processes, refer to our analysis of choosing a B2B website design agency.
Poor Technical Handoff Friction
A design process can execute perfectly and still fail at the handoff to engineering. This occurs when designers provide static mockups without a proper design system or detailed specifications.
This creates significant friction. Developers are forced to make assumptions about spacing, interaction logic, and asset specifications. The result is a final product that does not match the approved prototype. This failure translates directly into wasted development cycles and technical debt from implementing an inconsistent, undocumented UI.
Graphic Design FAQs for Technical Leaders
Even with a structured process, technical leaders often have recurring questions. These typically focus on business impact, not aesthetics.
How Do You Measure the ROI of Design?
Design ROI is measured by business metrics, not subjective appeal.
- Conversion Rates: An intuitive user flow can directly increase conversions. A 2-3% lift in sign-ups, checkouts, or demo requests is a tangible result.
- Reduced Support Load: A self-explanatory UI reduces usability-related support tickets, representing a direct operational saving.
- Engagement Metrics: Increased time-on-site, feature adoption, and user retention are indicators that the design is effective.
- Development Velocity: A well-constructed design system with reusable components allows the front-end team to ship features faster by reducing the need to build UI from scratch.
How Does This Process Fit into Agile Sprints?
Attempting to compress the entire design process into the same two-week sprint as development is a common anti-pattern that leads to rushed, untested work.
The most effective model is dual-track agile. Design operates one or two sprints ahead of development.
This provides the design team with the necessary time for discovery, research, and user testing. When engineering begins Sprint 5, they receive a design package for a feature that was fully vetted and de-risked in Sprint 3 or 4. This prevents development from building on an unstable foundation.
What’s the Best Way to Give Design Feedback?
As a non-designer, your feedback is most effective when it is tied to business outcomes, not personal taste.
Frame input around the agreed-upon project goals.
Instead of saying, “I just don’t like the color blue,” ask, “Does this color choice meet our accessibility standards and align with the brand attributes we defined in the project brief?”
This reframes the conversation from a subjective debate to a discussion about whether a design decision supports the project’s objective goals.
Making defensible vendor decisions requires unvarnished truth about implementation partners. Modernization Intel provides the market intelligence you need on partner costs, failure rates, and specializations, free from vendor bias. Get your vendor shortlist and de-risk your next project.
Need help with your modernization project?
Get matched with vetted specialists who can help you modernize your APIs, migrate to Kubernetes, or transform legacy systems.
Browse Services